Learning Objectives
After completing the lesson you will be able to:
1) Define baseline analysis
2) Identify when to use baseline analysis
3) Perform a baseline analysis for a process or project
Case Study
Plastic surgery resident Dino Maglić observes that plastic surgery division residents in the emergency department have access to two sets of surgical instruments. The first is a laceration tray that is readily available and disposable, but is small and poor quality. The second is a larger laceration tray that is high quality, preferred by residents, and is used in operating rooms, but is reusable and must be sterilized. The emergency department only has two of the high quality trays. Since on a given night there are roughly 10 consults, residents fall back on disposable sets. Aside from being less preferred by residents, there is a sense that the smaller trays have sub-optimal results for patients. Dino thinks better trays are possible—where should he start?
uality improvement projects start in your gut. You’ve found a problem that you are passionate about. You know it’s a problem because 1) you notice things aren’t going well and 2) other people have brought it up to you.
Your intuition may be correct, but you need hard data to verify it. It’s time to collect some evidence that there is indeed a gap in performance. It’s time to do a baseline analysis.
Understand the Current State and Get the Facts
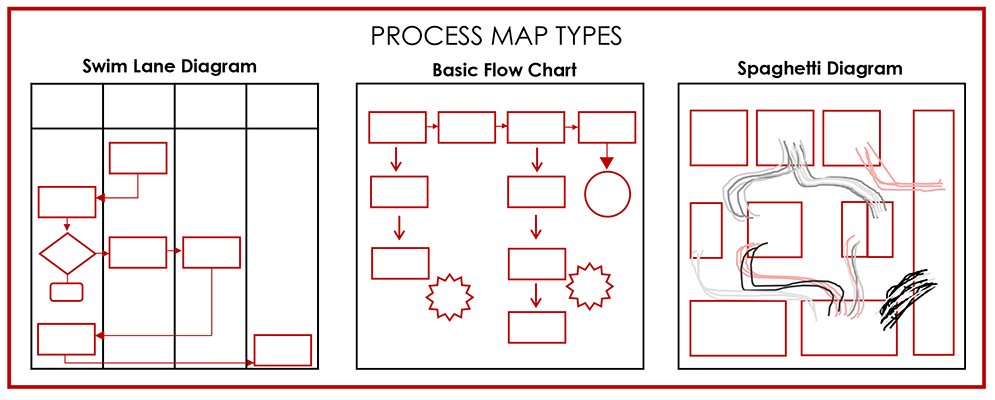
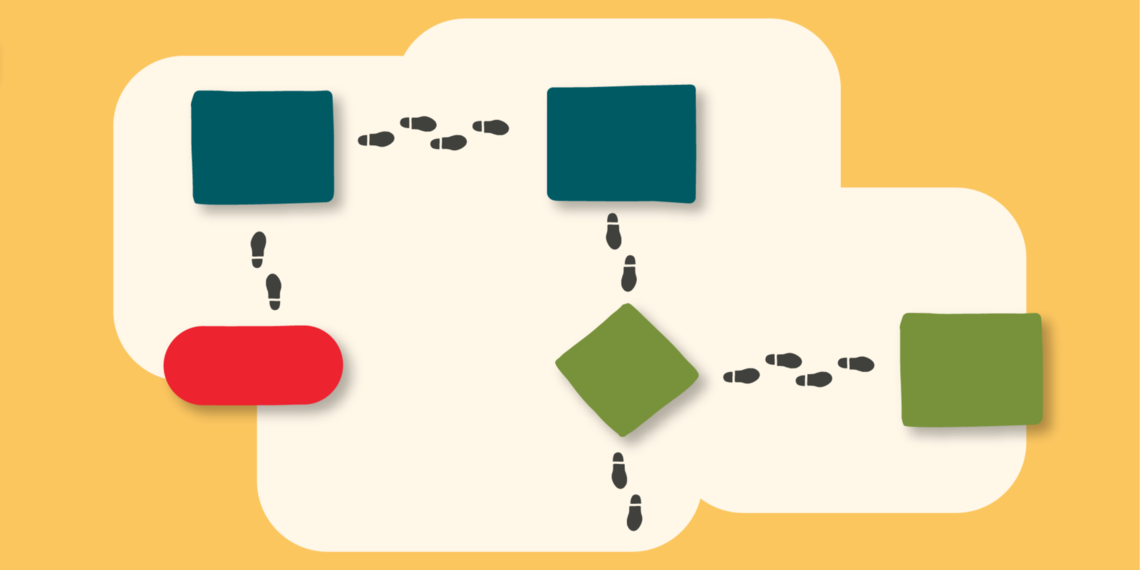
Use this resource to understand two visualization tools: Going to the Gemba and Process Maps.
What is baseline analysis?
Baseline analysis is the process of collecting data to substantiate that there is, indeed, a gap in performance. It establishes the current state of a particular process. Often, the baseline analysis includes a graphical visualization of the process and observation.
Why and when to use it?
You can verify a gap in performance with data analysis, process maps, and information collected by going to the gemba—the Japanese term for the place in an organization where value is created. That data can be in the form of photos, notes, or anecdotes. Even if the current process is going well, the quality improvement project aims to improve that performance. The baseline analysis step provides valuable information before designing and executing your intervention. After your intervention is done, it helps you know whether or not it worked.
Measure the Process Performance
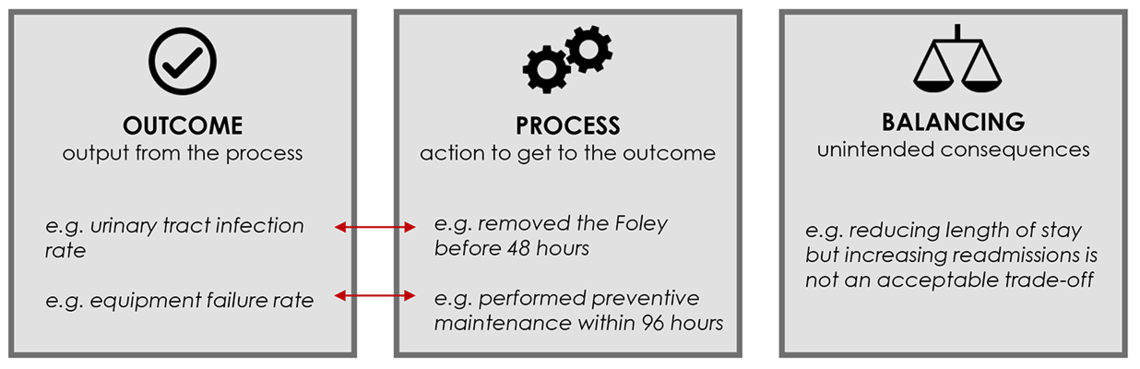
Use this resource to understand QI outcome measures and learn how to write a QI goal.
How does it work?
There are two ways to show the gap between your current performance and what you intend.
Numerically. Histograms, run charts, control charts, and data comparison provide information to show the gap in performance or how your changes to the process would make it better.
Visually. Process maps and photos give you a visual rendition of where or when the process is not performing as intended, or where it could be improved.
One of the key challenges in knowing how to start your baseline analysis is deciding what metric to focus on and how you are going to monitor it.
What it looks like in process
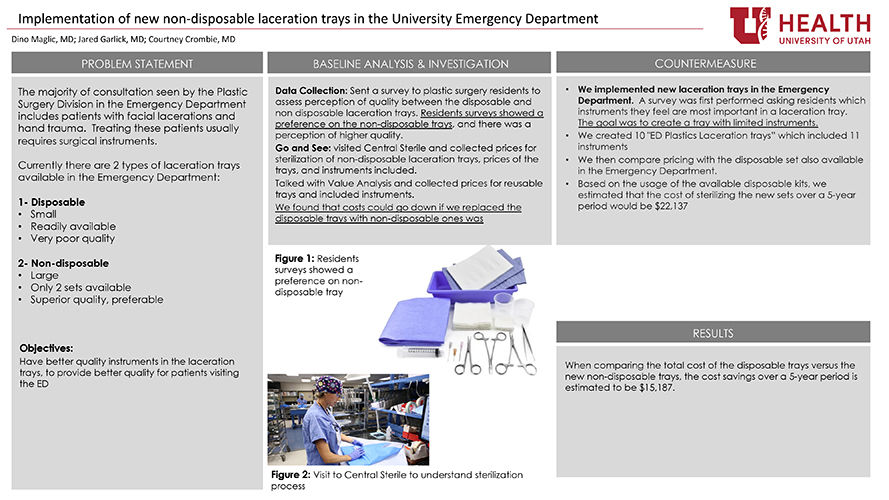
In our case study, Dino used visual and numerical data in his baseline analysis to show that switching from disposable trays to smaller, reusable trays would cost less over time.
Dino took photos of the disposable and reusable trays so that he could easily compare them as he collected data about costs. He then went to central processing to collect numerical data. He decided his focus metrics would be cost and time to reprocess instruments. Using those metrics he determined the cost of 10 trays with the assumption they would last five years. He worked with the value analysis team to determine how many disposable trays were used over a five-year period, and what that cost. From there he estimated how many times the reusable trays would need to be sterilized, and the cost for cleaning those trays.
Click the image below to read more about the implementation of new reusable laceration trays.
Conclusion
Performing a baseline analysis provides useful data to improve a process that is already in place or to begin a more extensive improvement project. It highlights the gaps between the current state and the intended performance.
Dino’s baseline analysis determined that the total 5-year cost of these kits would yield a cost savings of $15,187 over the same period. That was enough for the hospital to support the project and adopt the proposed change.
Originally published May 2020
Luca Boi
Why do some organizations thrive during a crisis while others flounder? Iona Thraen, director of patient safety, joined forces with her ARUP Laboratory colleagues to learn how the world-renowned national reference lab adapted to the pandemic. Leaders created a culture of safety by putting innovation, learning, and patient-centered care at the heart of all their efforts.
Finding evidence to change the status quo isn’t easy; thinking about evidence in terms of how it persuades—whether subjective or objective—can make it easier. Plastic surgery resident Dino Maglić and his colleagues followed their guts and saved money by improving the laceration trays used to treat patients in the emergency department.
What is the strongest predictor of an effective solution? It’s not the size of the committee or the length of the brainstorming session. The best predictor of successful solutions is how well the problem is understood. Investing time in defining, investigating and analyzing the problem can lead to transformative solutions.