
hat percentage of time is spent delivering what patients want? By that I mean, how much time actually meets the definition of the health care value-added test? How much time do we spend delivering care or providing information to patients? Take a guess. 50%? I’m not sure what the answer is, but I have a framework to measure it.
As a value engineer, I’m often seeking to improve the utilization of our resources to better meet patient needs. In an improvement project, we start first by understanding what is causing inefficiency, or waste. It can be difficult to consistently quantify and categorize the sources of waste, especially when considering a service, such as medical care. Manufacturing provides an interesting model for us to borrow.
The framework: Overall capacity effectiveness
In the manufacturing industry, a common metric for capacity utilization is known as Overall Equipment Effectiveness (OEE). OEE is the percent of time that the equipment is actually producing what the customer wants. OEE provides a consistent measure of utilization and helps us understand where we’re not being as efficient as we could be.
Let’s apply this concept to health care. In health care, what really matters to the patient is value-added (provision of care or information directly related to the patient’s health). This relationship happens inside an exam room with a provider. Interchanging equipment for the room, I’m coining the term Overall Capacity Effectiveness. This idea certainly isn’t a novel one; it’s simply putting a framework around how capacity is used to consistently measure the losses, or waste, and consequently the utilization of the room.
Example: Exam Room Schedule
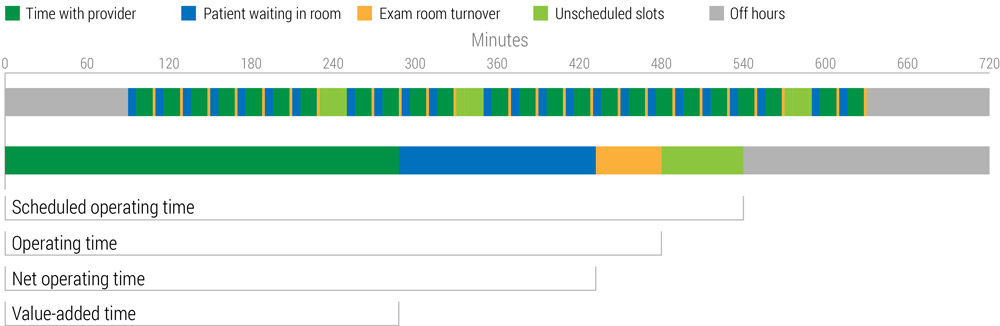
Scheduled operating time
This is the time that the room is available for scheduling. In this example, the scheduled operating time is 9 hours. In the case of exam rooms, the scheduled operating time would be 75% or nine out of 12 hours, assuming 12 hours is the maximum available time to operate the facility (a full 24 hours would also be acceptable depending on the service).
Operating time
This is the time within the available schedule that is actually scheduled or blocked. Operating time is most often impeded by variability in demand, i.e. more demand for morning appointments versus afternoon (think of the line at your favorite lunch spot around 12:30pm) or scheduling inefficiency. For example, within the nine hour exam room schedule, if patients are only scheduled for six of those hours, the operating time would be 50% or six out of 12 hours.
Net operating time
This includes the time the patient spends with the provider and the time spent in the exam room without the provider. Simply put, this is the time the patient is in the exam room. Gaps between net operating time and operating time include any time that the room is scheduled for use but is not occupied by a patient. Considering the 20-minute appointment, if the patient spends five minutes waiting for room turnover and travel to the exam room, then only 15 minutes of their 20-minute appointment is actually spent utilizing the room. Assuming this is consistent across all scheduled appointments, the net operating time would be 37.5%. Calculated as 4.5 out of 12 hours.
Value-add capacity utilization
Is the time the patient spends in the room, with a provider, interacting in such a way that fulfills the health care value-added test. In other words, if a discussion of the patient’s health information or a direct care provision isn’t occurring, the time will not be counted towards value-add utilization. Gaps between net operating time and value-add capacity utilization include any wait time or idle time while the room is occupied. Back to our 20-minute appointment, if the patient spends 15 minutes in the room but only 10 minutes meets the value-add requirements, the value-add capacity utilization would be 25% or three out of 12 hours.
In our 20-minute appointment example, we saw that we are only utilizing our exam rooms about 25% of total available calendar time. Even if we constrain our available time to business hours, or scheduled time, our Overall Capacity Effectiveness is still only at 33%.
Okay, so what do I do with this information?
The primary benefit of this framework is a consistent and methodical way to realistically assess performance of what matters to patients: direct care provision and information related to health. When faced with increasing demand and constrained resources, the easiest (and also the most expensive) option is to add additional facilities, staff, or operating hours. Although the scheduled operating time may appear to be high, or in other words the schedule is full, there may be more efficient methods of improvement available. Calculating net operating time and Overall Capacity Effectiveness can provide a more realistic representation of value added utilization. Starting here is much more “lean” than simply adding staff or facilities. If we can more fully understand the problem, we can design more appropriate solutions.
| Where do you need more capacity? | Possible cause | Possible solution |
|---|---|---|
| Scheduled operating time |
|
|
| Operating time (unutilized schedule) |
|
|
| Net operating time |
|
|
| Value-added interactions |
|
|
Will McNett
Why dedicate space to the hot poker that is health law and policy on this website? Context. We are an improvement community. We believe providing context is an act of respect. Talking about "the why" of complex healthcare topics (payment reform included) allows our frontline clinicians and staff to be empowered and informed.
Delivering a great health care experience is only possible with one crucial component: reliable scheduling. It’s such an essential part of efficient operations, in fact, that the University of Utah Health created an access optimization team to help providers across the system.
Sterile Processing runs a lean operation, delivering millions of instruments to University of Utah Health’s procedural teams. Director of value engineering Steve Johnson, assisted by the video wizardry of Charlie Ehlert, sheds light on our system’s unseen infection prevention heroes.